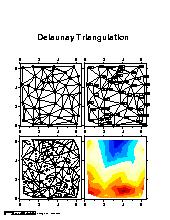
#!/bin/bash
#		GMT EXAMPLE 12
#
#		@(#)job12.bash	1.10  03/11/99
#
# Purpose:	Illustrates Delaunay triangulation of points, and contouring
# GMT progs:	makecpt, minmax, pscontour, pstext, psxy, triangulate
# Unix progs:	$AWK, echo, rm
#
# First draw network and label the nodes
#
triangulate table_5.11 -M > net.xy
psxy -R0/6.5/-0.2/6.5 -JX3.06i/3.15i -B2f1WSNe -M net.xy -W0.5p -P -K -Y4.65i > example_12.ps
psxy table_5.11 -R -JX -O -K -Sc0.12i -G255 -W0.25p >> example_12.ps
$AWK '{print $1, $2, 6, 0, 0, 6, NR-1}' table_5.11 | pstext -R -JX -O -K >> example_12.ps
#
# Then draw network and print the node values
#
psxy -R -JX -B2f1eSNw -M net.xy -W0.5p -O -K -X3.25i >> example_12.ps
psxy -R -JX -O -K table_5.11 -Sc0.03i -G0 >> example_12.ps
$AWK '{printf "%lg %s 6 0 0 5 %lg\n", $1, $2, $3}' table_5.11 | pstext -R -JX -O -K -W255o -C0.01i/0.01i -D0.08i/0i -N >> example_12.ps
#
# Then contour the data and draw triangles using dashed pen; use "minmax" and "makecpt" to make a color palette (.cpt) file
#
z0=`minmax table_5.11 -C -I25 | $AWK '{print $5}'`
z1=`minmax table_5.11 -C -I25 | $AWK '{print $6}'`
makecpt -Cjet -T$z0/$z1/25 > topo.cpt
pscontour -R -JX table_5.11 -B2f1WSne -W0.75p -Ctopo.cpt -L0.25pta -G1i -X-3.25i -Y-3.65i -O -K -U"Example 12 in Cookbook" >> example_12.ps
#
# Finally color the topography
#
pscontour -R -JX table_5.11 -B2f1eSnw -Ctopo.cpt -I -X3.25i -O -K >> example_12.ps
echo "3.16 8 30 0 1 2 Delaunay Triangulation" | pstext -R0/8/0/11 -Jx1i -O -X-3.25i >> example_12.ps
#
\rm net.xy topo.cpt .gmtcommands